EDA for Image Data
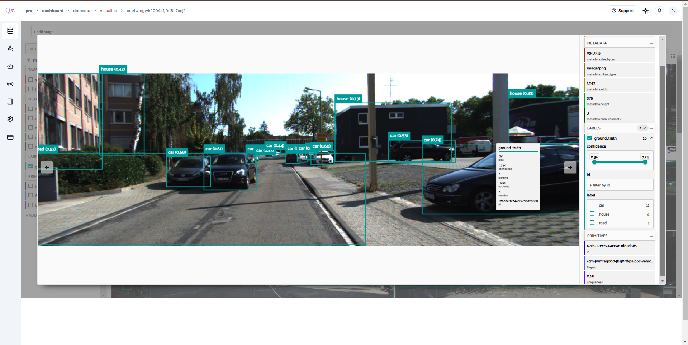
QpiAI Pro’s data visualization tool empowers you to explore your annotations with incredible precision. Filter by confidence threshold and other criteria to quickly identify key insights and areas of focus. Here is a sample of the visualization window.
In QpiAI’s visualization tool, you can filter your dataset using UI controls available in both the grid and expanded sample views. When you click the caret (dropdown) icon next to any field name, you’ll see filtering options for that field. The tool updates in real-time to display only the matching samples and labels as you adjust these filters.
Let’s explore how filtering works using a vehicle dataset as an example.
-
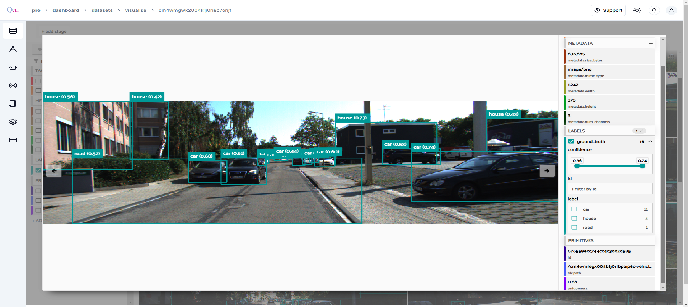
Look for the confidence score slider under the labels section in the sidebar - you can use this to filter your vehicle data by confidence levels.
💡This slidebar can be used to filter the images by confidence score.
-
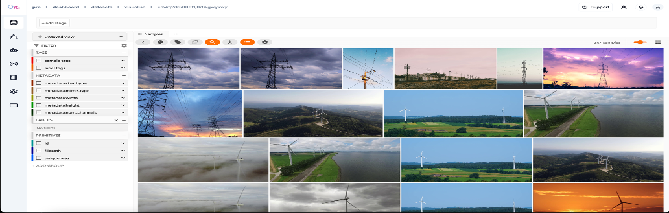
In the labels section, navigate to the ‘label’ subsection where all dataset classes are displayed. You can refine the annotations by selecting one or multiple classes according to your requirements.
💡View a sample Select a sample to view its detailed information in an expanded window. This view shows all the sample’s fields and provides access to its JSON representation.
To customize which attributes appear in the tooltip when viewing labels with multiple dynamic attributes, hover over a label and press `ctrl` to lock the tooltip. You can then use the show/hide buttons to select which attributes you want to be displayed.
Using the image visualizer
The image visualizer allows you to interactively visualize images along with their associated labels. When you hover over an image in the visualizer, a head-up display (HUD) appears with a control bar providing various options.
For example, you can zoom in/out and pan around an image by scrolling and click-dragging with your mouse or trackpad. You can also zoom tightly into the currently visible (or selected) labels by clicking on the Crop icon in the controls HUD or using the z keyboard shortcut. Press ESC to reset your view.
When multiple labels are overlaid on top of each other, the up and down arrows offer a convenient way to rotate the z-order of the labels that your cursor is hovering over, so every label and its tooltip can be viewed.