Model Validation Framework
Pro supports a visual model validation framework to compare multiple trained models on the same dataset. It allows users to evaluate model performance metric-wise— all in a single view. This helps streamline decision-making by avoiding manual checks and enabling faster deployment choices based on visual insights.
Steps to Use +
-
Click on the Model section, then click on the “Compare Model” button. This opens the Model Card view.
-
Select the models you want to view.
Note: Converting and loading models may take a few minutes.
-
The dashboard opens, click on the “Comparison” tab.
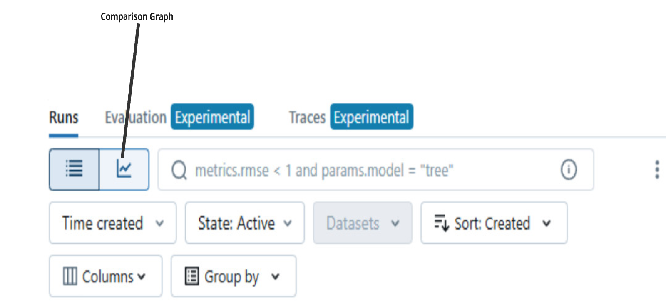
- Select experiments you want to compare — performance metrics will be shown side-by-side.
This visualization works well for:
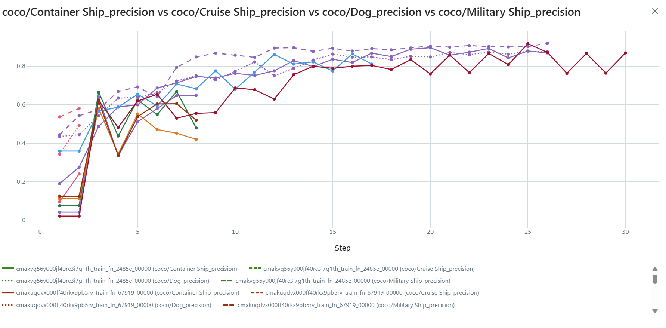
Same dataset (e.g., Beverages dataset) with different models (e.g., SegFormer vs DeepLabV3+). Matrix Types Supported:
-
Matrix Type 1:
- Train Loss, Validation Loss, and Other Losses (e.g., loss, bbox loss)
- Available for all model types.
-
Matrix Type 2:
- Class-wise Metrics for Object Detection and Instance Segmentation Data Should be the same but Model can be any .
- Not available for LLM-based models, as they use CSV input/output without defined class labels.
-
Matrix Type 3:
- Same model on different datasets Example: A single model (e.g., SegFormer) trained on datasets like Beverages, Space, and Container Ships.
- You can view matrix results based on:
-
Model type
-
Class-wise metrics
- Steps:
- Select your experiments.
- Click Compare.
-
Go to the Visualization tab.
-
In the Parameters column, select the Model Type.
-
In the Matrix column, choose Class-wise Matrix or any other available matrix.
-
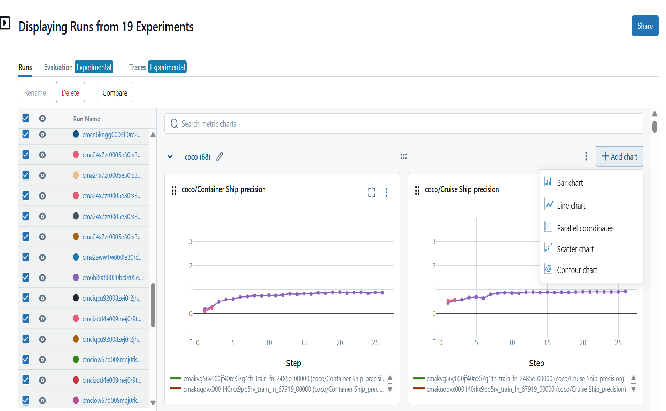
View the matrix details as shown in the image examples
-
Way 2 – Add Custom Chart (All-in-One Configuration)
-
Click on “Add Chart” → Select “Line Graph”.
-
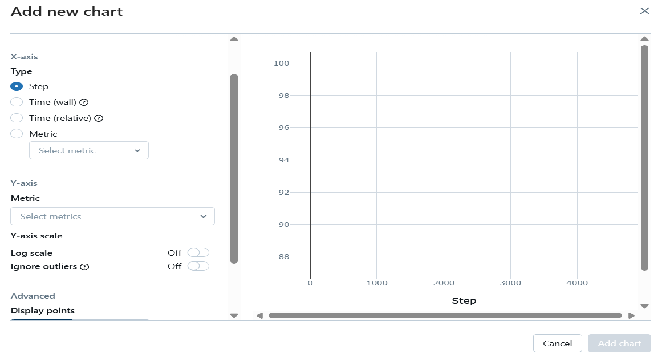
A custom chart will appear.
-
Set:
-
X-axis = Steps
-
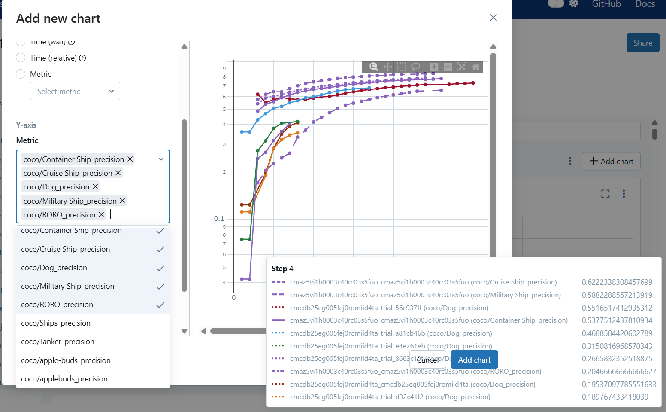
Y-axis = Any matrix you want to compare (e.g., Class-wise, Loss)
-
-
This allows comparing multiple matrix types in one visual.
Way 3 – Configure Existing Chart
-
over any existing matrix chart.
-
Click the ellipsis (three dots icon) → Select “Configure”.
-
In the config panel:
-
X-axis = Steps
-
Y-axis = Class-wise matrix you want to compare.
-
-
Click Save to update the chart.
 Note: A detailed walkthrough video on Model Validation will be available soon.
Please visit our official website and search for “Model Validation” to watch how to effectively use these features.
Note: A detailed walkthrough video on Model Validation will be available soon.
Please visit our official website and search for “Model Validation” to watch how to effectively use these features.