Prediction
Steps to Create and Run a Prediction
Step 1: Navigate to the Prediction Section
-
From the left-hand sidebar, click on Prediction.
-
This will open the Prediction Dashboard.
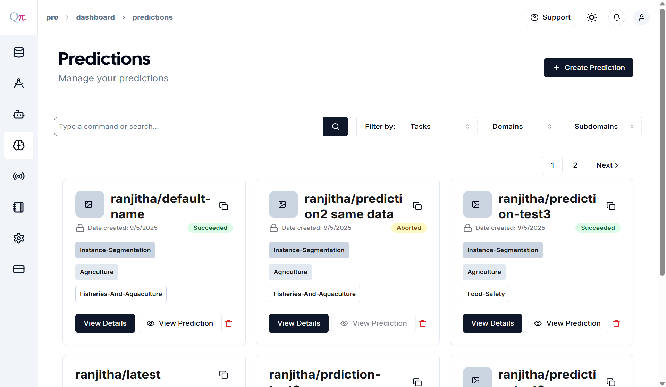
Step 2: Start a New Prediction
-
On the dashboard, click “Create Prediction +”.
-
A repository will be created with a default name.
-
Click Create.
-
Once created successfully, you will see a confirmation pop-up and be redirected to the Prediction Page.
Step 3: Choose Data Input Method
- On the Prediction Page, you have two options:
Option A: Create a New Dataset
-
Upload data directly from your local machine (folders).
- Make changes for class as well , tick and untick whatever class you want
-
Once uploaded, you will receive a success pop-up message.
Option B: Select an Existing Dataset
-
Choose an already available dataset.
-
After selection, a success pop-up will appear.
-
Configure the repository:
-
Select or unselect the required classes.
-
Click Update.
-
A toast message will confirm the update.
-
💡Example: If you already have a dataset and two trained models (e.g., Faster R-CNN and RTMDet), use the Select Existing Dataset option to run predictions with both models.
Step 4: Start Prediction
-
After dataset configuration, click Start Prediction.
-
Wait for the prediction process to complete.
Status Indicators:
- 🟡 Yellow – Prediction in progress
- 🟢 Green – Prediction completed successfully
- 🔴 Red – Prediction failed (retry or report issue)
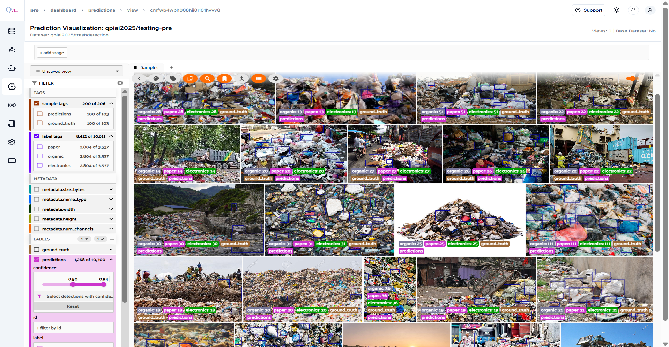
Step 5: View Results
-
Once the prediction completes, click View.
-
Review the prediction results for the selected dataset
-
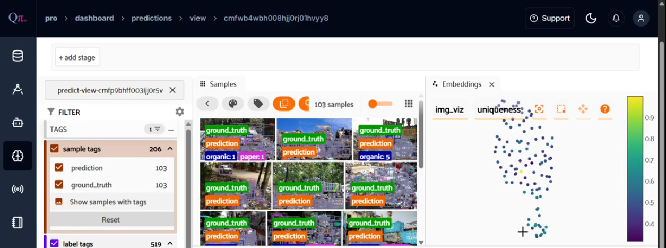
From the toolbar, click Tag, assign a descriptive label and then use the sidebar to filter and view only the samples with those tags.
-
Click on “+” icon to open the Embeddings panel.
-
From the dropdown menu, select the field you want to analyze the embeddings, and then explore the scatterplot to see how objects cluster and relate.
- To view histograms ,Click on “+” and then navigate to the Histograms panel. From the dropdown menu, select the field you want to analyze. You can then adjust the number of bins to refine the level of detail shown in the histogram.
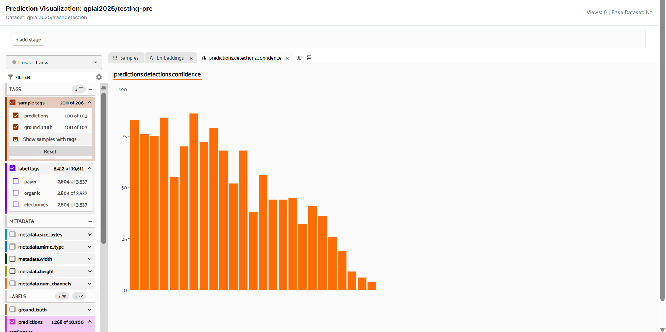
- For comparison, Select Predictions to evaluate against Ground Truth, adjust the IoU threshold if necessary, and review the side-by-side results.
💡 Note: The same steps apply to both Object Detection and Instance Segmentation predictions.