Image Embeddings
QpiAI provides a powerful embedding visualization capability that you can use to generate low-dimensional representations of the samples and objects in your datasets
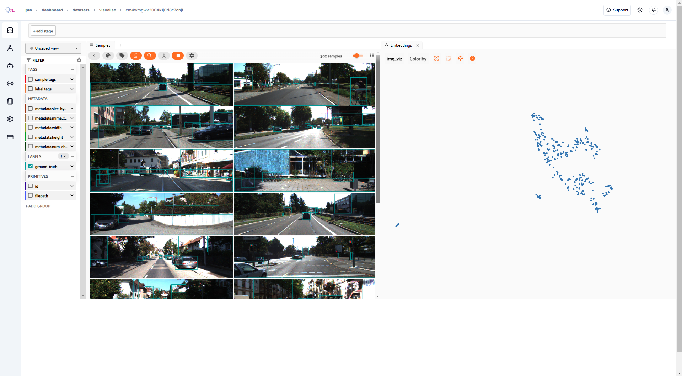
- Opening the Embeddings panel in the QpiAI pro visualization tool allows you to explore and interact with a scatterplot visualization of your dataset’s embeddings. Select the brain_key, which will load the embeddings on the panel. You can then select points by drawing a lasso around them, which filters the Samples panel to show only those selected items.
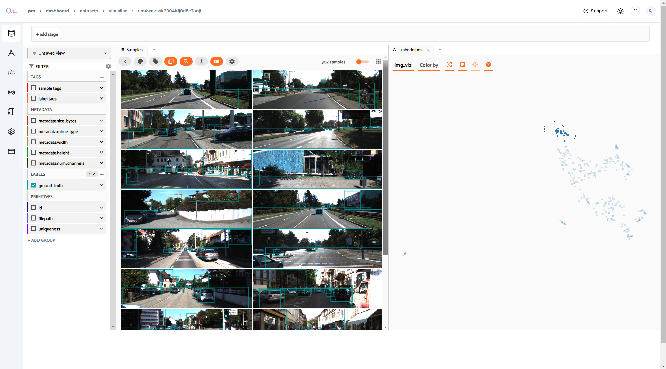
The embedding UI also provides a number of additional controls:
- Press the pan icon in the menu (or type g) to switch to pan mode, in which you can click and drag to change your current field of view
- Press the lasso icon (or type s) to switch back to lasso mode
- Press the locate icon to reset the plot’s viewport to a tight crop of the current view’s embeddings
- Press the x icon (or double-click anywhere in the plot) to clear the current selection
The lasso tool helps identify image clusters by letting you select and filter groups of embeddings. This reveals patterns in your dataset by showing related images together, effectively functioning as a visual classification system.
Histogram Panel
The QpiAI pro visualization tool’s histograms panel displays statistical distributions across your dataset in different modes:
- Check sample and label tag distributions in the Sample tags and Label tags modes
- View class distributions for ground truth and model predictions under the Labels mode
- Explore numeric and categorical field distributions, such as uniqueness scores, in the Other fields mode
In the Histogram, we have multiple filtering options, which consist of image metadata like confidence, label, height, width etc.
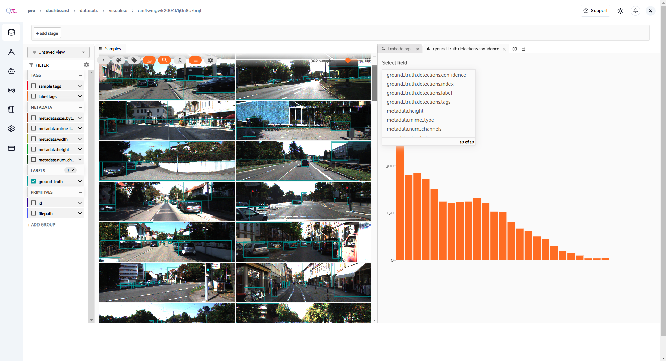
When you apply filters, the system generates separate histograms for each selected feature.